

You are here
Back to topHow do you calculate derating curve ?
DC to DC converter is commonly used in extreme environment like industrial, automotive and railway application. Therefore, the product verification of performance and reliability at high/low temperature is very crucial. During the design verification, not only the product must be able to operate normally at the high temperature, but each part of the product must also meet its own specifications, such as resistance, capacitance, PWM IC or other semiconductor. Part which operating at over specification maybe reduce the reliability of the parts, leading to increased risk of product damage.
Common thermal evaluation methods, as shown in Figure 1 below
- Thermal simulation software
- Thermocouple
- Thermal imaging cameras
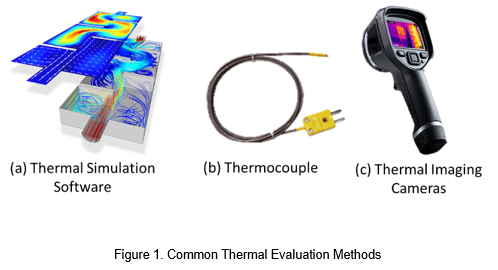
If there are lots of parts need to be tested. In this situation, it's suitable to use thermal imaging camera to find the hottest part. If the number of parts to be tested is small. It can use thermocouple to measure the temperature of each part.
However, the safest way is to use thermal simulation software to calculate the thermal behavior of each part at the beginning. And then, use thermal imaging camera to find out the part which has highest temperature rise. Finally, use a thermocouple to measure the part which has high temperature rise at room or high ambient temperature. The derating curve of converter is defined by these temperature data. User can used derating curve to check whether the converter is operating within a safe operation area or not.
On the other hand, the thermal resistance can be calculated by temperature rise and power loss of the converter. By using thermal resistance and actual power loss, which can get the temperature rise of the converter. Just added with the estimated ambient temperature, the converter can be evaluated in advance for normal operation or not.
Introduction
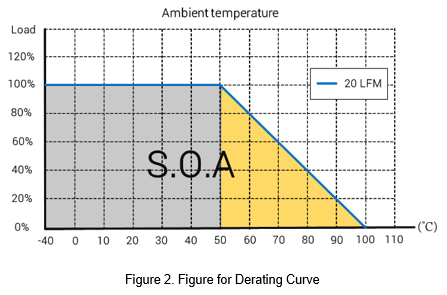
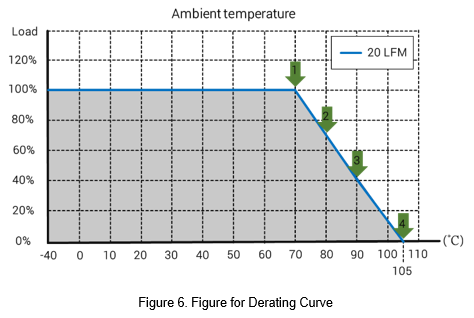
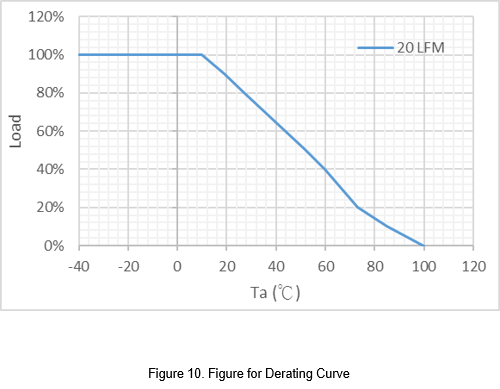
Figure 2 is a diagram of the derating curve, which contain three information in it.
(1) Environmental convection conditions.
(2) Output load.
(3) Operating temperature.
As shown in the gray area, the converter can operate at full load from -40°C to 50°C. When the ambient temperature exceeds 50°C, the output load must be reduced, as shown in the yellow area. For example, when the ambient temperature is 80℃, the output load can't over than 40% of the full load.
The definition of the derating curve can be divided into three steps
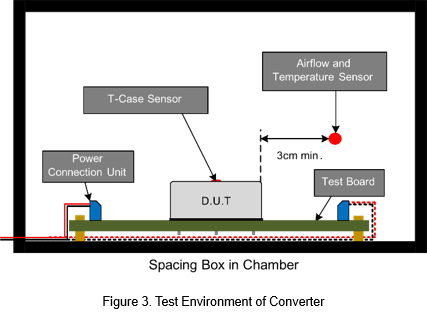
- Test set-up for the converter.
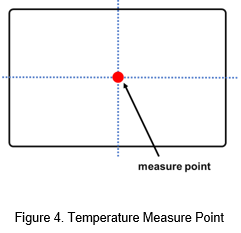
Figure 3 is the test environment of the converter. The converter is placed in the enclosed area with a size of about 30 * 30 * 20 cm, simulating the no air flow or 20LFM test condition. Measuring the ambient temperature inside the box and the maximum case temperature of the converter. The measurement point of ambient temperature is 3 cm away from the converter. Maximum case temperature is the central point of converter, as shown in Figure 4.
- Thermal resistance
Thermal resistance is a heat property and a measurement of a temperature difference by a material heat flow. It can be calculated by the following formula.
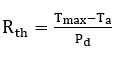
Ta : Ambient temperature.
Tmax : Converter maximum case temperature.
Pd : Power dissipation.
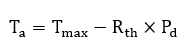
After calculated the thermal resistance. Next step is using efficiency curve to get the power dissipation for different load. And then, the temperature rise and operable ambient temperature of the converter can be obtained.
- High/Low temperature verification
The purpose of using a chamber to simulate the converter working under the combination of high or low temperature and humidity, in order to confirm whether the converter is operating normally.
During the test verification, the converter will be verify at different temperature and loads base on derating curve. Taking Figure 6 as an example, it will verify the converter and internal parts at 70°C (100% load), 80°C (70% load), 90°C (40% load), 105°C (0% load). All the parts need to meet the corresponding temperature specifications.
Application
The following will use a quarter brick converter as an example. From calculating thermal resistance and get the derating curve. Table 1 shows the specifications of the converter, and Figure 7 shows the efficiency curve of the converter.
| DC to DC Converter | RQ150WR3-11054 |
| Input voltage | 110 Vdc |
| Output voltage | 54 Vdc |
| Output current (full load) | 2.778 A |
| Baseplate temperature limit | 105 ℃ |
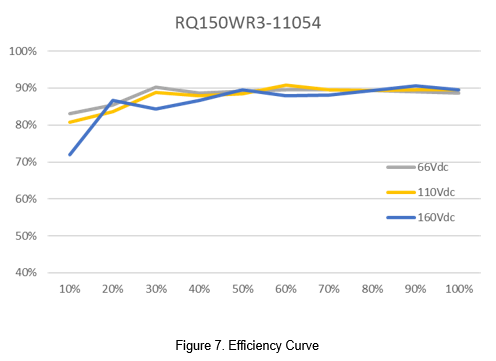
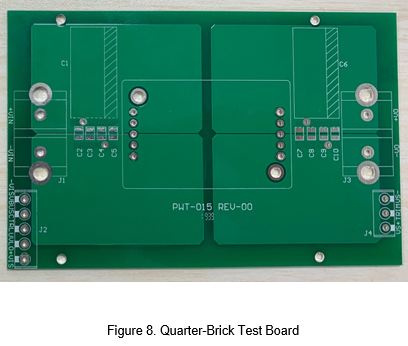
Figure 8 is a quarter-brick test board. The test board has four 2oz copper foils on the top and bottom sides. The purpose of the copper trace is to increase the conductive heat dissipation area.
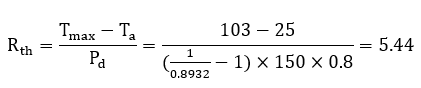
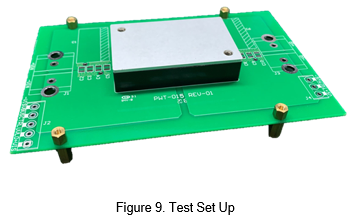
The converter is placed in the enclosed area with a size of about 30 * 30 * 20 cm as mentioned before. Figure 9 shows the quarter brick converter mounting on the PCB. Base on measurement result. It can be found that the converter can not operate at full load for a long time at 25℃, it will trigger the over temperature protection. It can only be tested under 80% load. The efficiency at this time is 89.32%.
Ta : 25℃
Baseplate temp : 103℃
Base on above information, the thermal resistance should be 5.44℃/W.
Base on thermal resistance and the power loss under each load condition, the maximum operable temperature can be calculated, as shown in Figure 10. For example, the efficiency at full load is 89.53%. Maximum baseplate temp : 105℃.
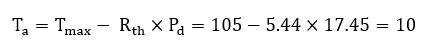
So, the operating ambient temperature at full load should be 10℃.
As it can see from the derating curve, lowering the ambient temperature, it can increase the operable power of the converter.
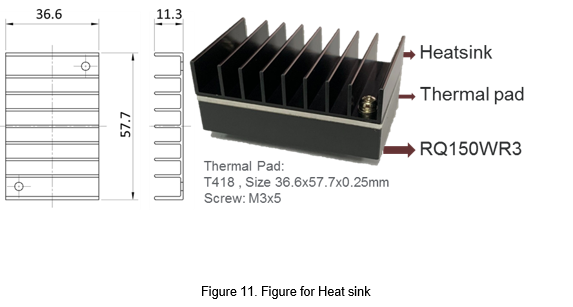
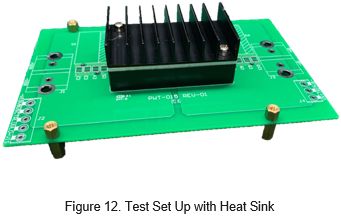
In order to get more output power at high ambient temperature, increasing the heat dissipation area is the better way. Such as attaching the base plate of converter to the system metal case. Or, add a heat sink to the converter, as shown in Figure 11.
Usually the heat sink or the base plate of converter will be separated by thermally conductive glue to increase the insulation distance and fill the gap between the two metal media through the glue to avoid poor contact.
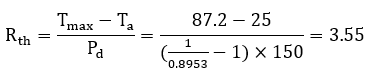
Using the same conditions, it can found that the base plate temperature is 87.2°C, when the converter was operating at full load. The ambient temperature is 25°C, and the efficiency was 89.53%.
Base the above information, the thermal resistance can be calculated as 3.55℃/W.
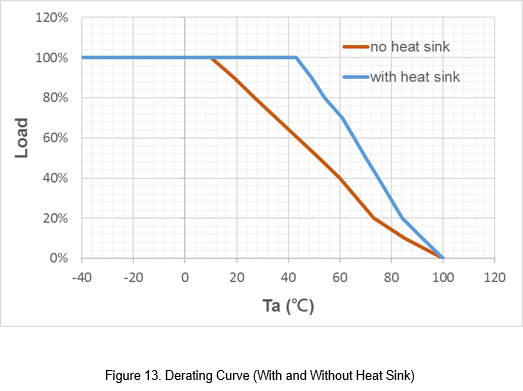
The maximum operable temperature can be calculated with the loss under each load condition after the thermal resistance is obtained. Figure 13 shows the temperature difference with and without the heat sink.
Finally, it can verified that the combination of each temperature and load for the converter by the chamber. To make sure the base plate and part will operate at safe operating temperature.
Conclusion
In order to make sure the converter is suitable for high temperature application, high temperature verification is crucial. By confirming the derating curve of the converter, or by calculating the thermal resistance, confirm the converter is operating within a safe operating range is the best way.
CTC is a professional service provider for high-end power supply modules (AC to DC Converter and DC to DC Converter) for critical applications worldwide since 30 years. Our core competence is to design and deliver products with leading technologies, competitive pricing, extremely flexible lead-time, global technical service and high-quality manufacturing (Made In Taiwan).
CTC is the only corporation certificated with ISO-9001, IATF-16949, ISO22613(IRIS), and ESD/ANSI-2020. We can 100% ensure not only the product, but also our workflow and service to match quality management system for every high-end application from the very beginning. From design to manufacturing and technical support, every single detail is operated under highest standard.